Fun with polygons

Introduction⌗
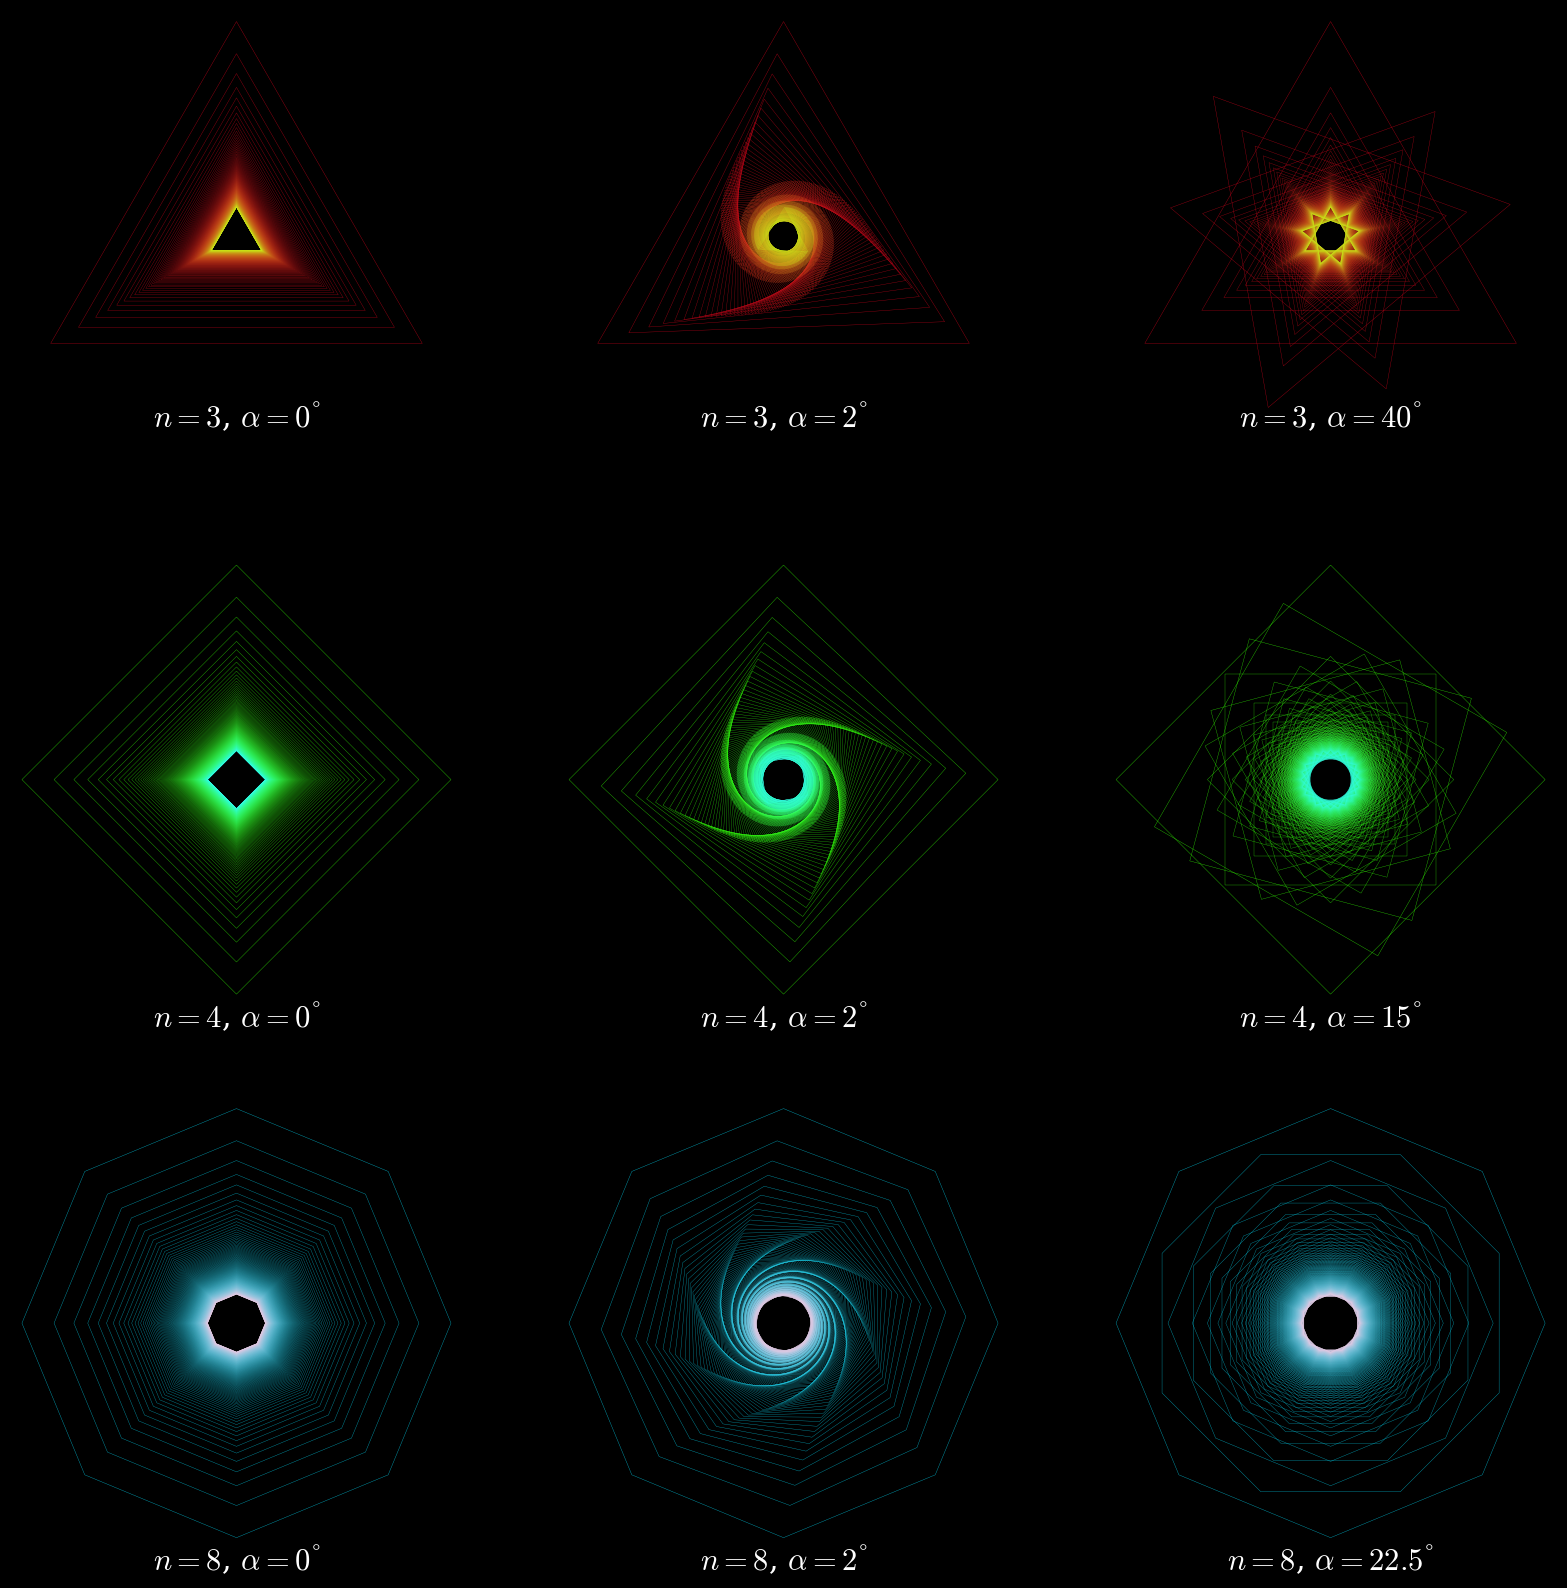
In Matplotlib is it a simple task to plot a regular polygon. A regular polygon is a plolygon with all the of equal length, this also implies that the angle between adjacent sides are all the same. Below, I’ve plotted a regular triangle, a square an an octagon. It’s a simple task as well to turn the polygon with a given angle and set the color of the edges.
The Figures⌗
The Code⌗
The full code is available on Github, and I will go through the core here.
First, we need to import some libraries:
import matplotlib.pyplot as plt # For all kind of plotting
import matplotlib.patches as mpatches # For plotting the ploygons
import matplotlib as mpl # For turning the polygons
import numpy as np # For linspace
Then we need to create the figure and the ax (this topic on StackOverflow is about subplot)
fig, ax = plt.subplots(
	1, 1, # Just 1x1 grid in this example
	figsize=(5, 5),
	dpi=100)
ax.set_xlim(-1, 1)
ax.set_ylim(-1, 1)
Now, we add the polygon with some parameters:
polyParams = {
	'facecolor':'none', # The fill color
	'edgecolor': [0.5, 0, 0.5, 0.75], # red, green, blue, opacity, values between 0 and 1
	'numVertices':5, # Number of vertices
	'radius':1,
	'xy':(0,0) # The center of polygon
}

polygon = mpatches.RegularPolygon(**polyParams)

# We may also specify a rotation in params ('orientation'), but we will
# do it in another way below.

# Rotate and add the polygon to the ax
rotationParams = {
	'x':0,
	'y':0,
	'degrees':45
}

transform = mpl.transforms.Affine2D().rotate_deg_around(**rotationParams)

ax.add_patch(polygon)
polygon.set_transform(transform+ax.transData)

# Hide the axis
plt.axis('off')

# And set the aspect ratio to equal (e.g. a circle looks like a circle)
ax.set_aspect('equal')

# Save and show the figure, if you like
# fig.savefig('polygons.png', bbox_inches='tight')
plt.show()
This is the code to handle and show a regular polygon (a pentagon in this case), I think its pretty straight forward.
The rotation could been done easier with the orientation parameter in polyParams, but there are
much more things that can be done with the transform.Affine2D() method. For example scaling, skewing
and transslation of the patch, se reference here.
The difference between the above code sample and the code producing a chart of multiple polygons is just a matter of dimensions. I was astonished of the beautiful interference patterns (and other patterns) the polygons of various sizes and orientations may result in.